Geo analytics — maps that show what's important.
Recognition and analysis of geographical patterns and spatial relationships to optimize transport networks, location decisions and route management using location-based data sources.
Status:
19/12/2025

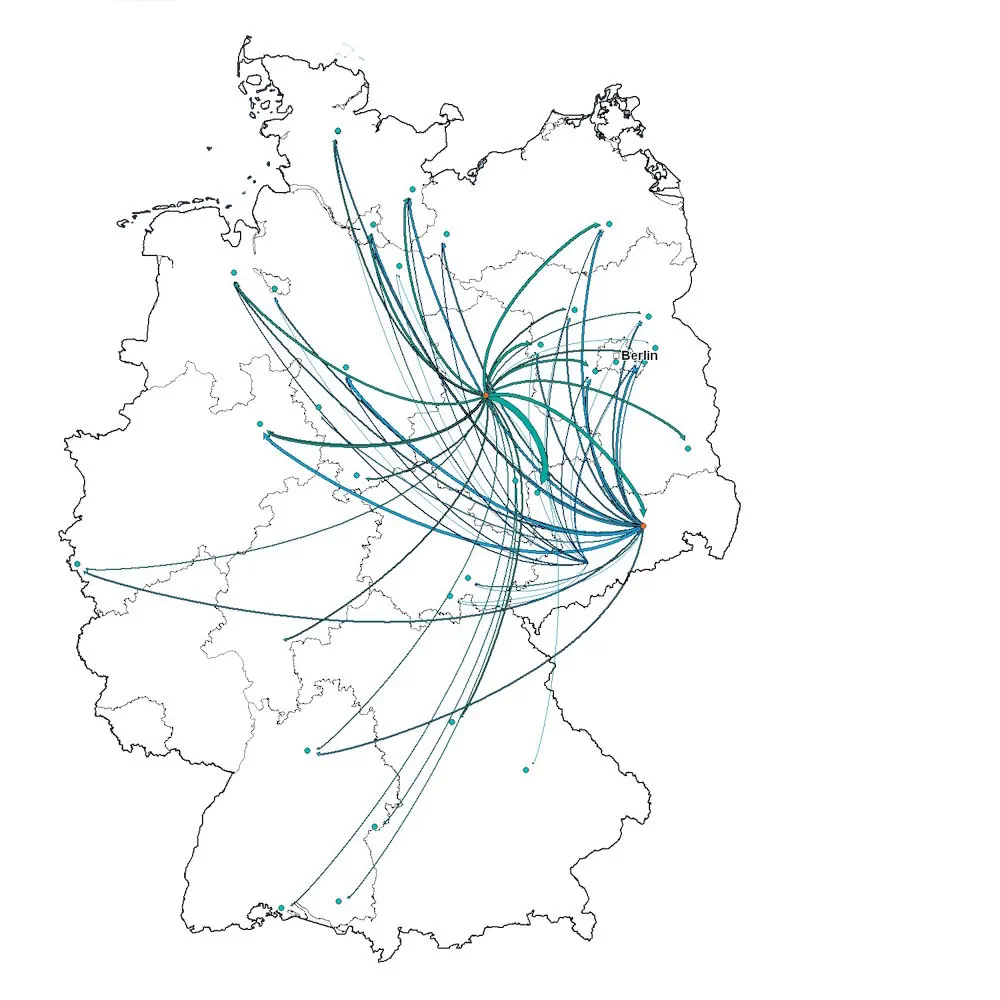
Visualizing complex data
Data says a lot. Maps tell the whole story.
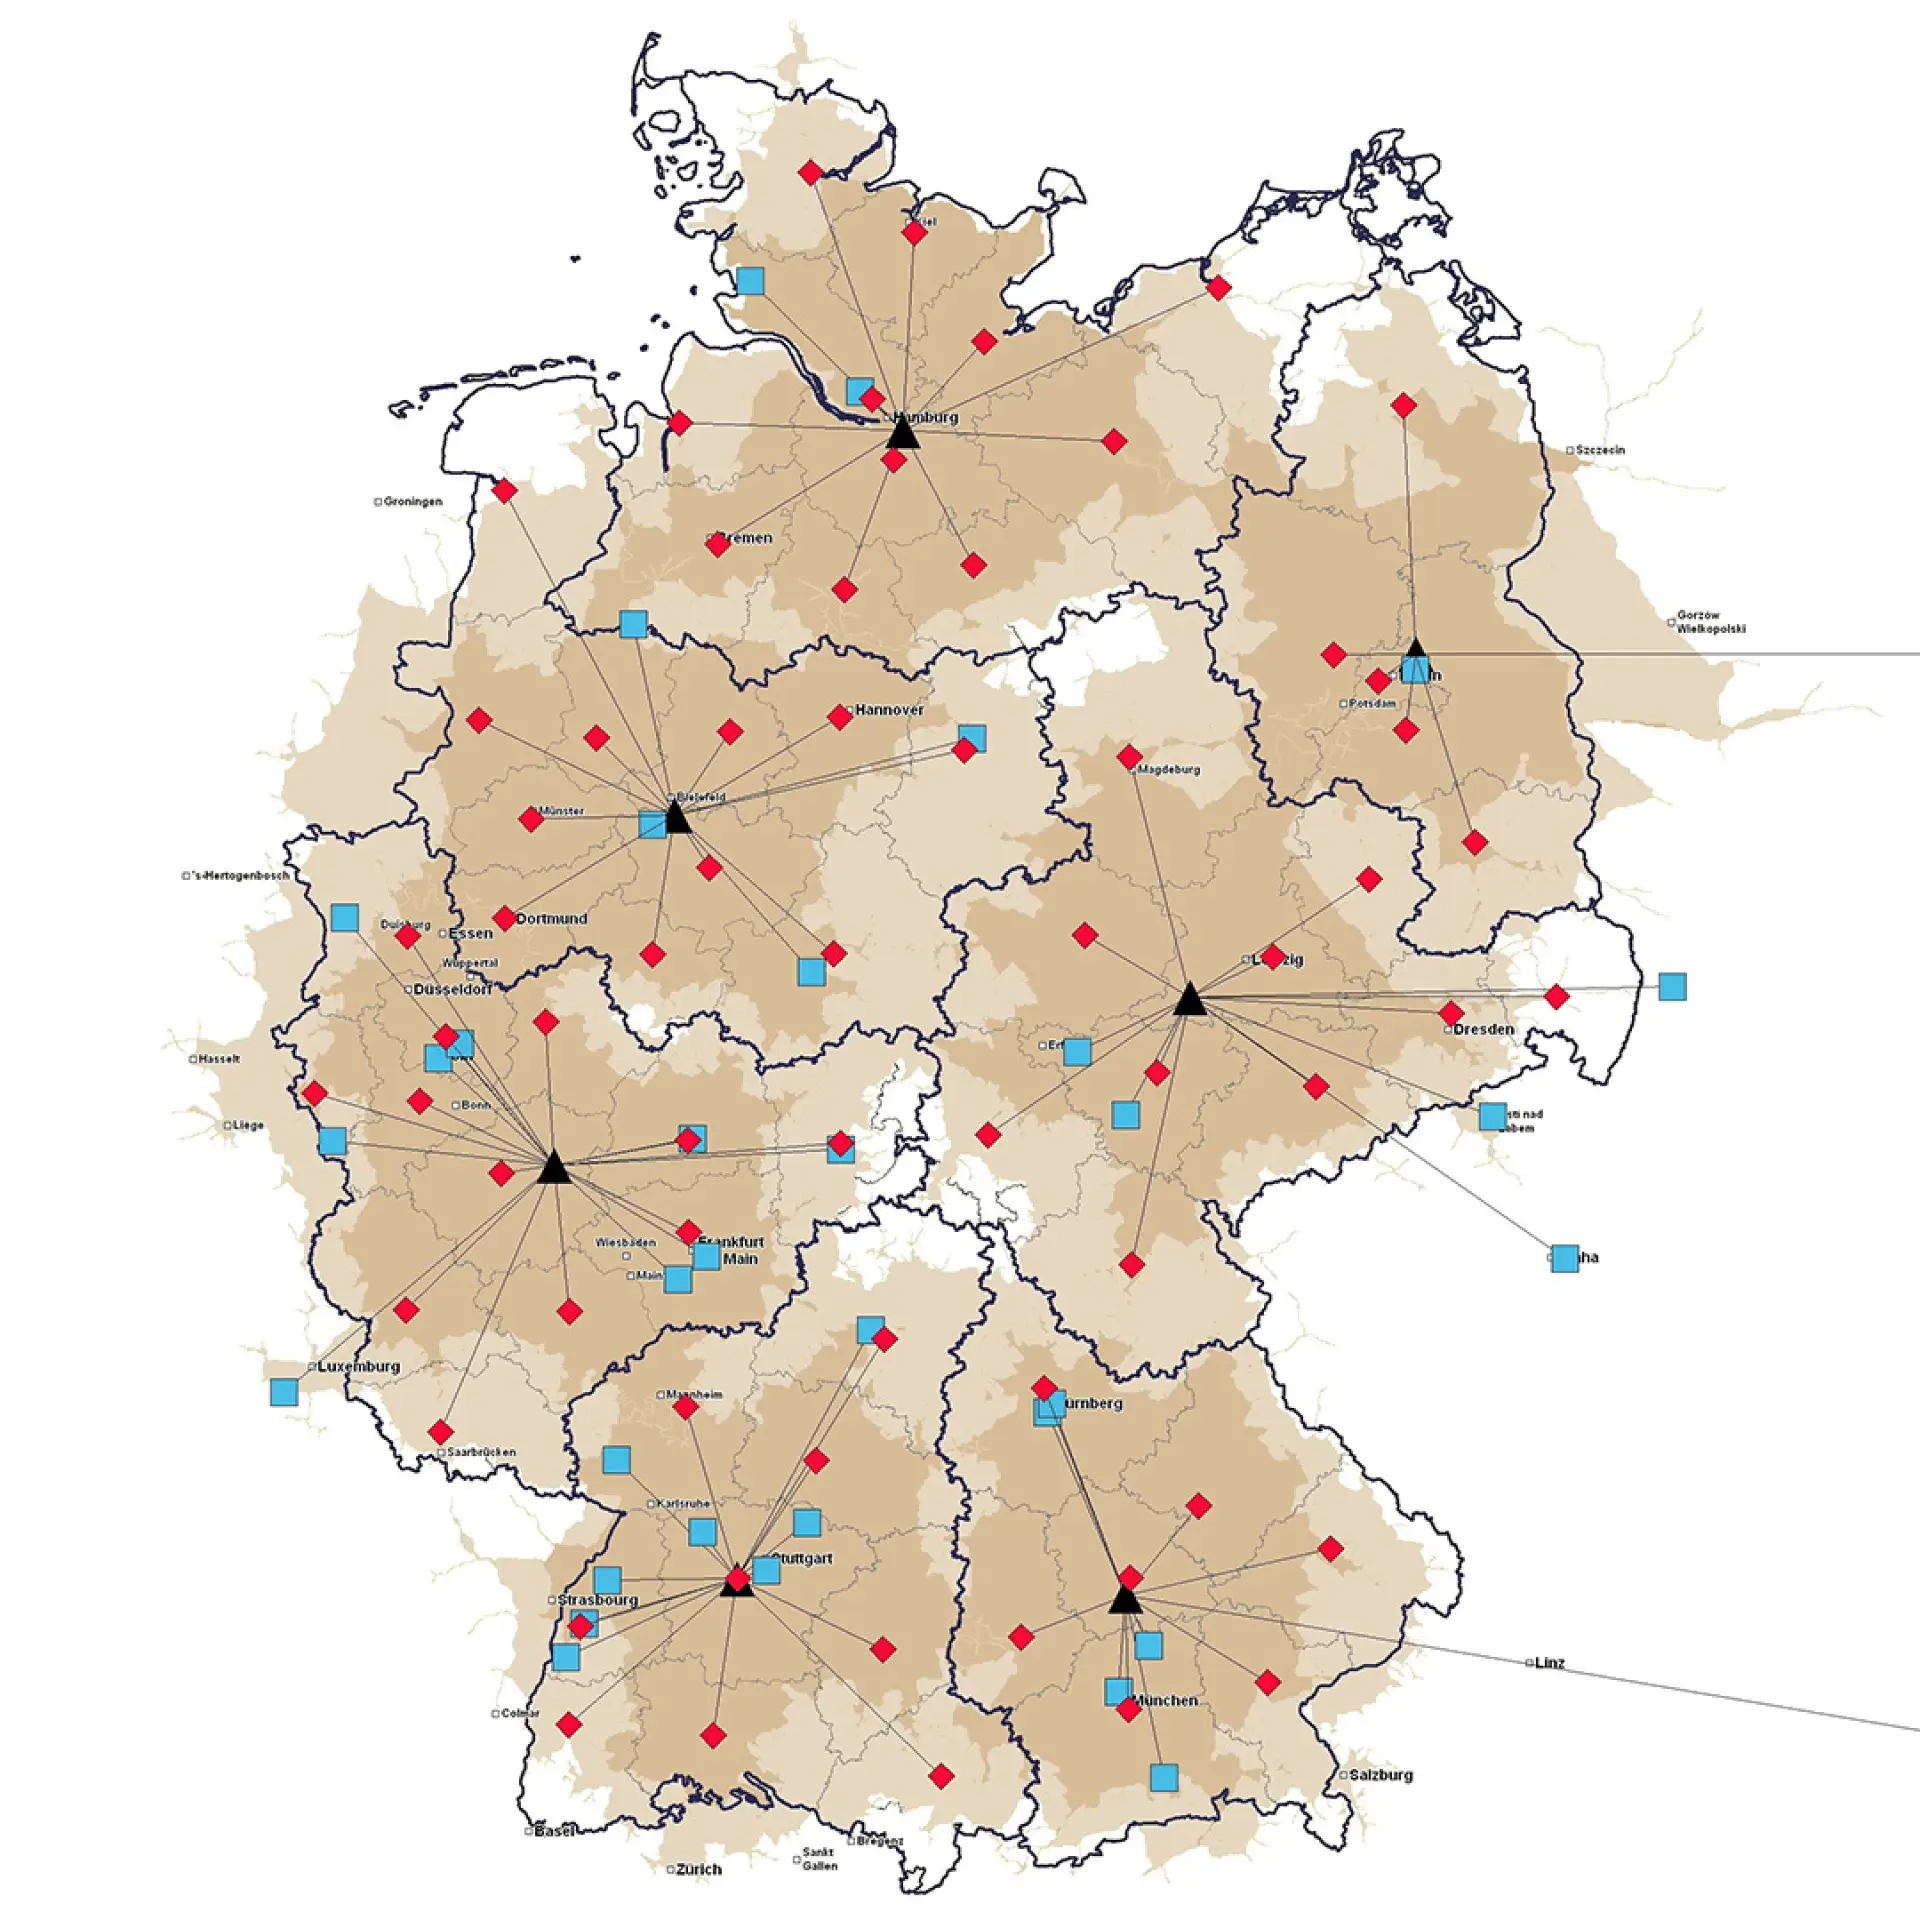
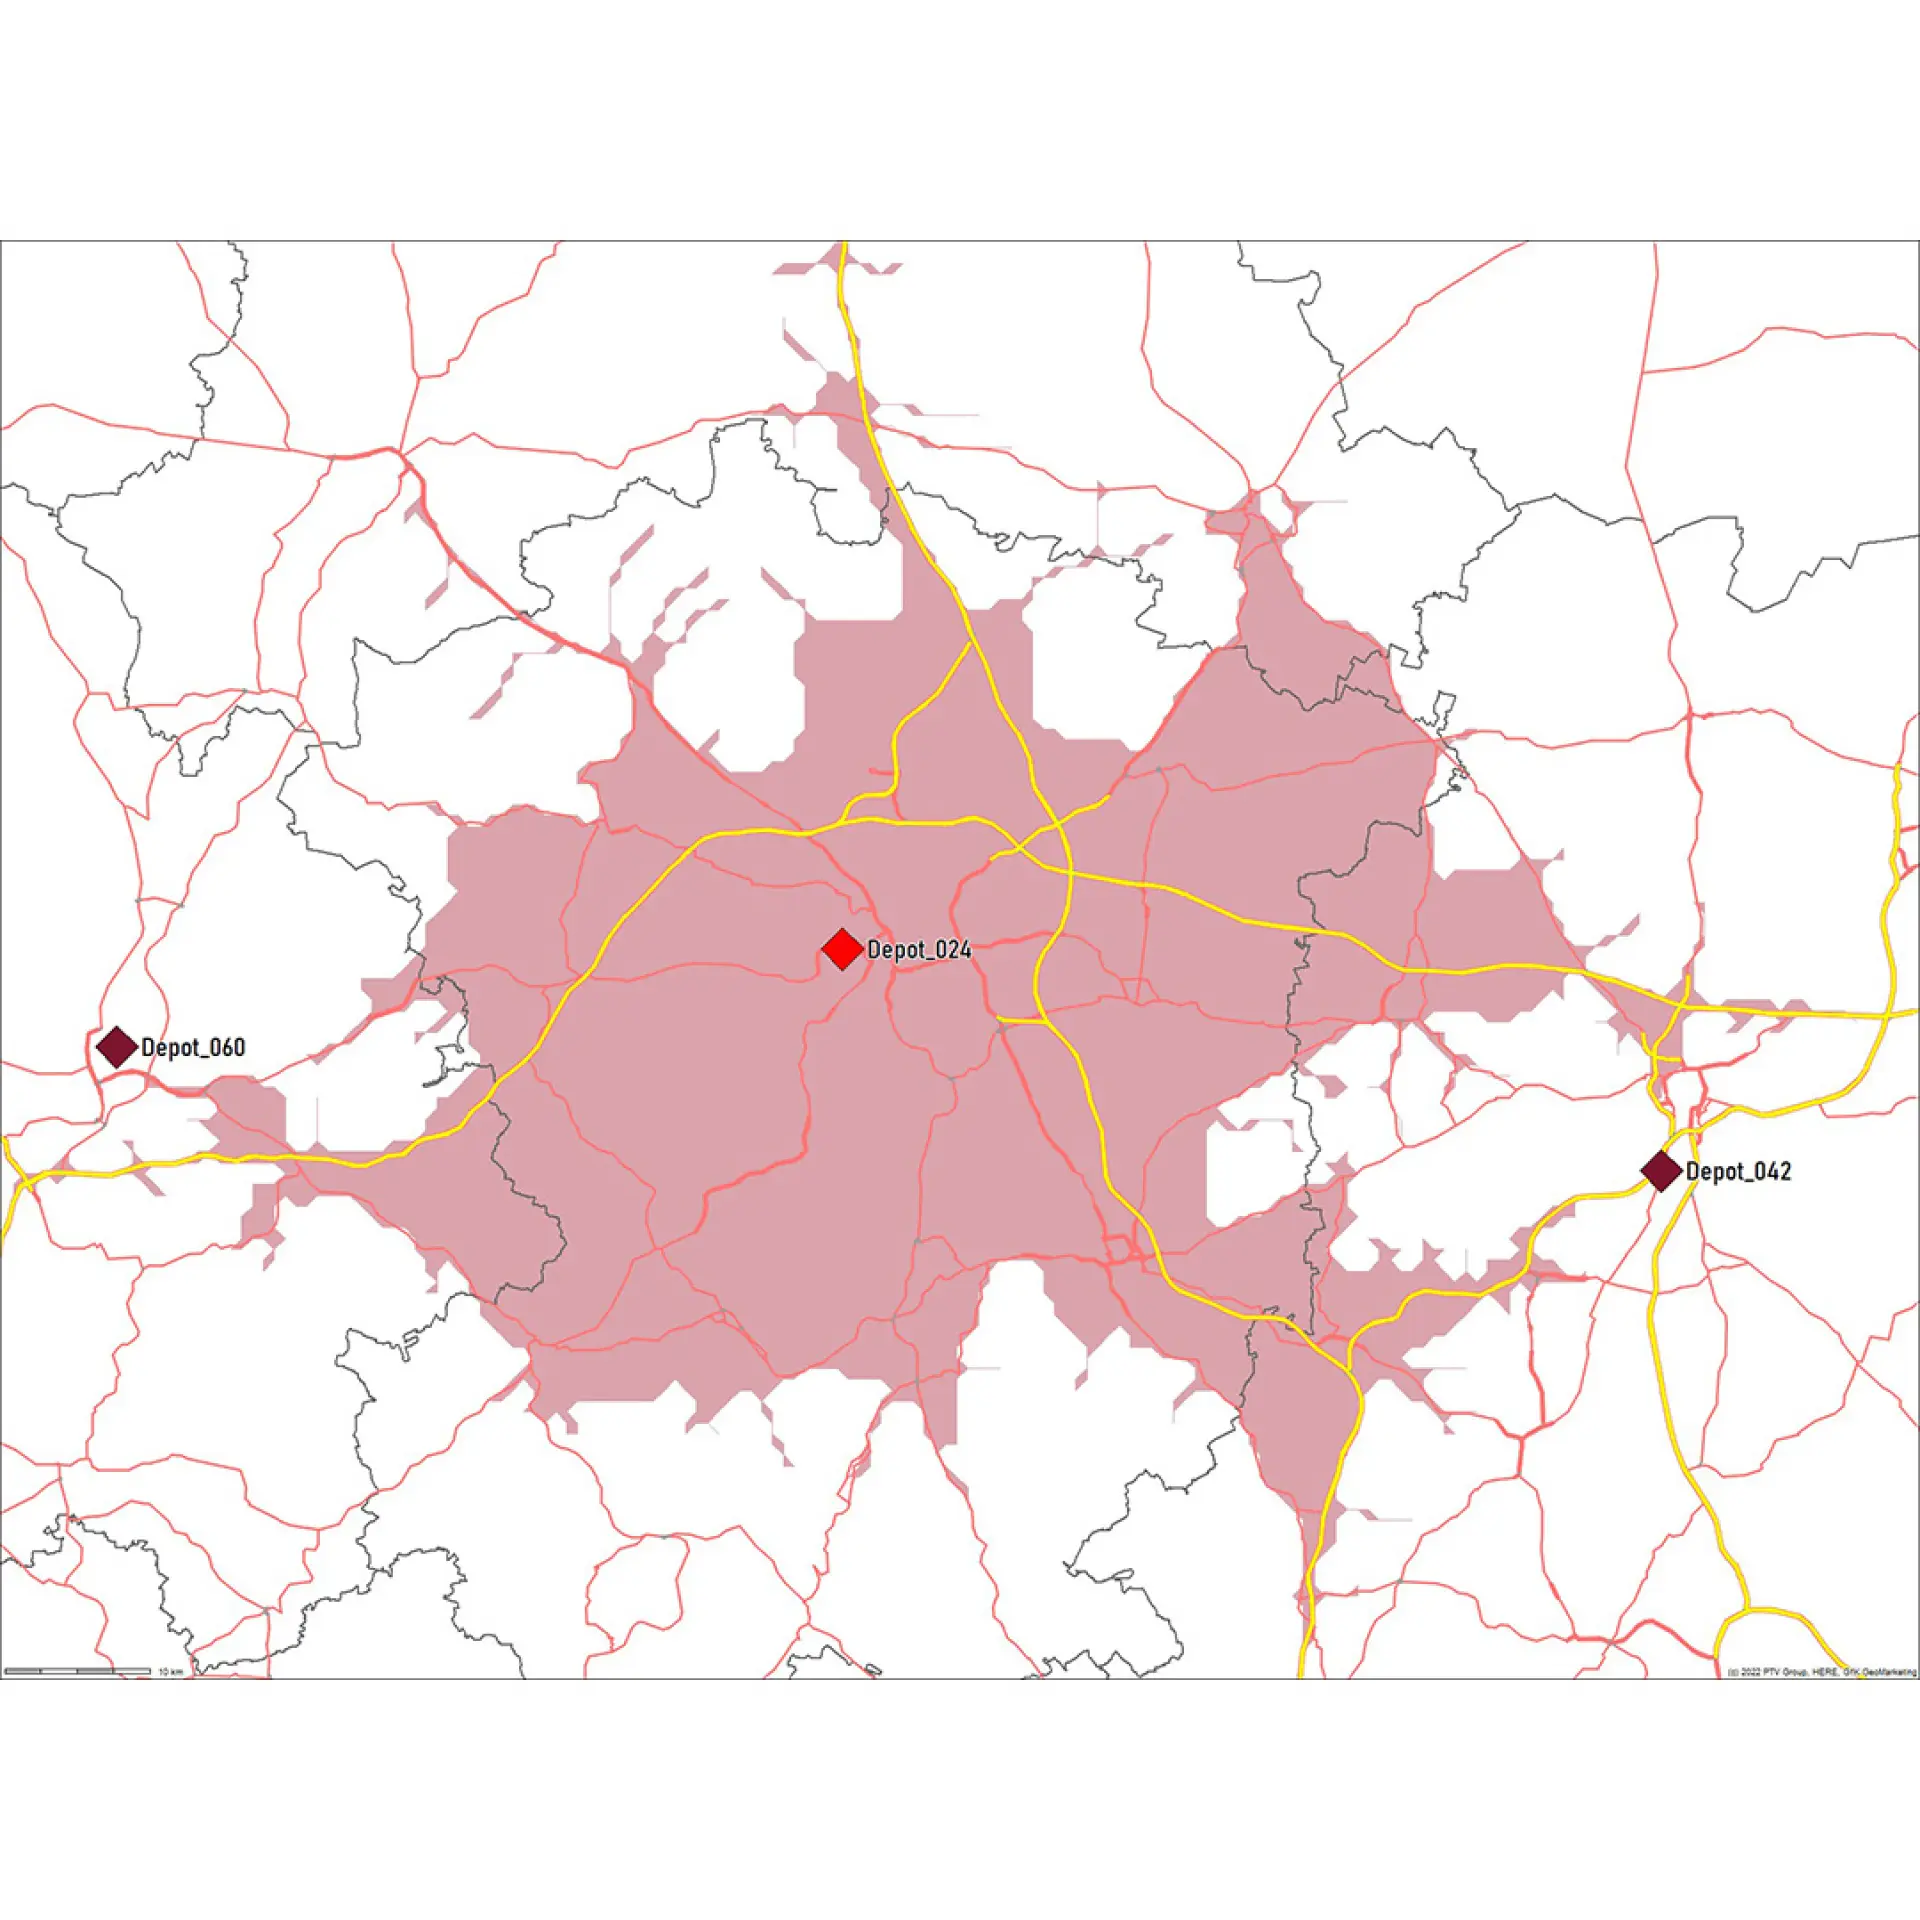
In our projects, visualization, i.e. the presentation of complex data on a geographical map, is a central tool. Whether locations, supply areas, routes or network coverage — the graphical presentation makes it possible to identify relationships more quickly and communicate better.
Among other things, we use area visualization to:
- creating decision-making bases for planning and optimization,
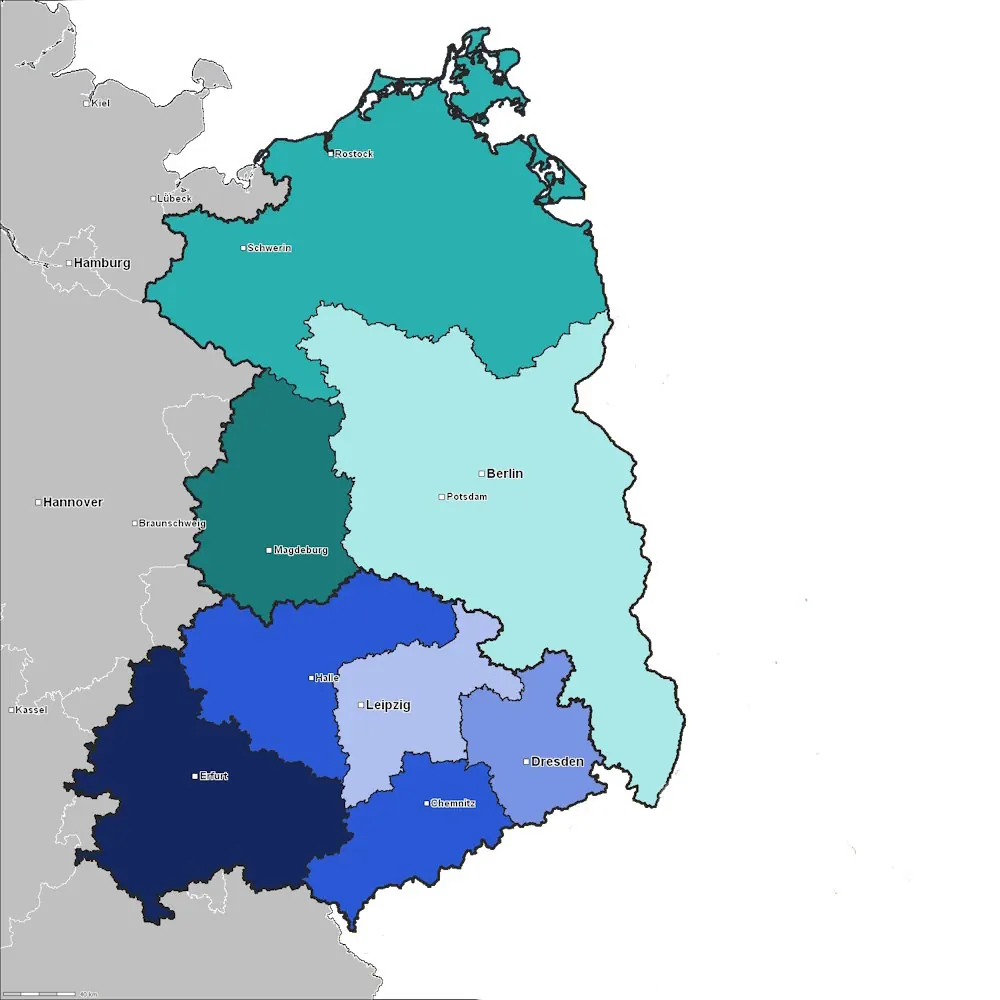
- clearly present existing network structures,
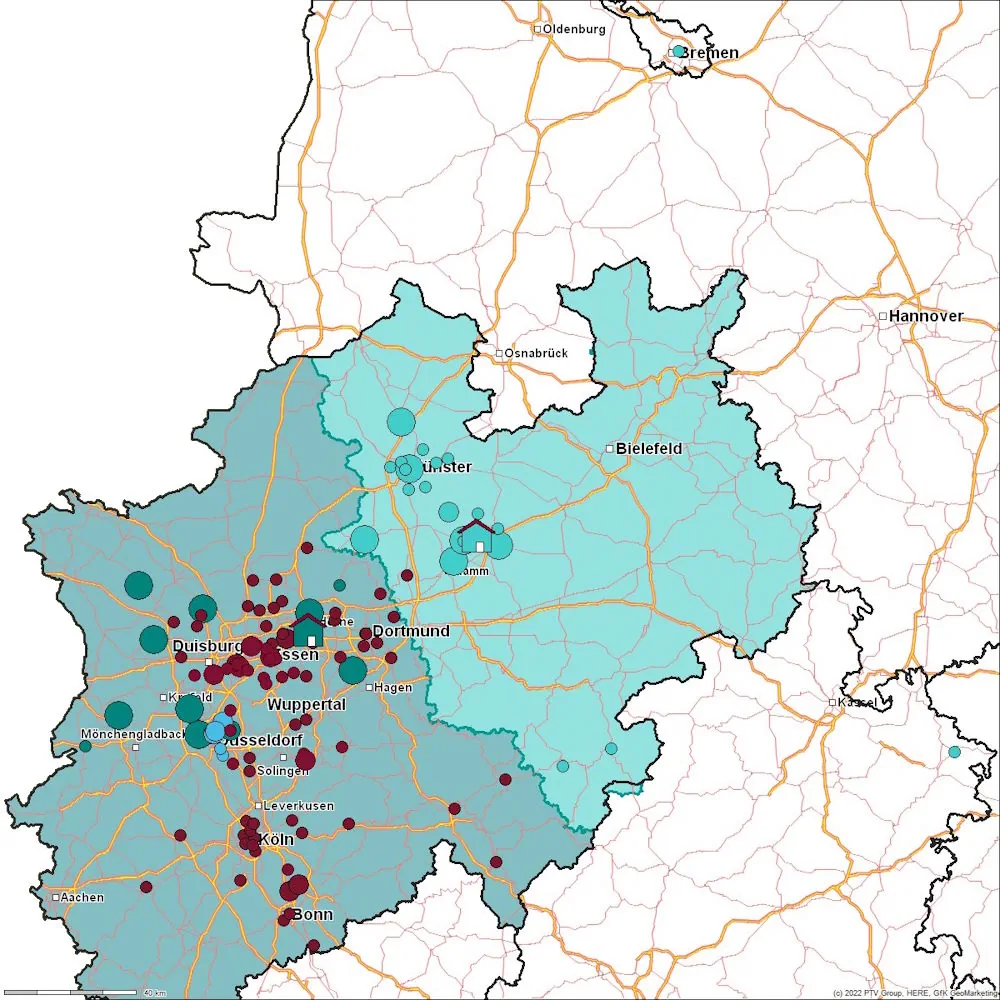
- to analyze and evaluate area and route patterns, and
- to make changes in the network visually comprehensible.
In short: The maps are not only an analysis tool, but often also a common medium of discussion — understandable, concrete and visually accessible.
Turn your data into insights — with clear, map-based visualization.
Let's make your data visible together. Get in touch with our team of experts


Your contact person
